Beyond the Vibe Check: A Systematic Approach to LLM Evaluation
TL;DR: I’m outlining a repeatable, measurement-first approach to evaluating LLM systems so teams can ship with confidence instead of gut feeling.
👥 Who Should Read What?
Executives/PMs (20 min read):
- Introduction
- Understanding Evaluation Dimensions
- The Evaluation Process
- Conclusion
ML Engineers (35 min read):
- All of the above +
- Evaluation Methods
- Evaluation Metrics
- Known Limitations
Researchers/Specialists (60 min read):
- Everything + Appendix
Introduction: Why LLM evaluation is the critical bottleneck in AI product development
You’ve built an LLM-powered feature. The prompt engineering looks solid. You have tested the model responses, they seem… good? You show it to your team, they nod approvingly. SHIP IT 🚀
Then users report hallucinations, irrelevant responses or other kind of failures. You’re relying on “vibe checks”—subjective impressions that don’t scale.
This is the evaluation bottleneck strangling GENAI products development.
Why traditional metrics fail
BLEU and ROUGE measure n-gram overlap. They work for constrained tasks like translation but break completely for LLMs. Check the following example:
from nltk.translate.bleu_score import sentence_bleu, SmoothingFunction

reference = ["The company was founded in 2018".split()]
candidate_good = "2018 marked the company's founding year".split()

smooth = SmoothingFunction().method1
bleu_good = sentence_bleu(reference, candidate_good, smoothing_function=smooth)

print(f"BLEU score: {bleu_good:.4f}")
Output:
BLEU score: 0.0408
💡 Even though both sentences have the same meaning, BLEU gives a very low score because it measures n-gram overlap, not semantic similarity. It rewards verbose responses that happen to overlap with references, even when they bury useful information.
The deeper problem: LLMs handle open-ended tasks without single correct answers. How do you score a product description, code explanation, or story outline? Traditional metrics measure surface similarity when we need semantic correctness, relevance, and usefulness.
The new complexity
Evaluation difficulty has exploded as LLMs grew:
- Long-context understanding: Models processing 100k+ tokens. Does your system work equally well whether the answer is in paragraph 1 or 292?
- Multi-hop reasoning: Questions requiring synthesis across sources. Your model may excel at lookups but fail at comparisons and inferences.
- Open-ended generation: Tasks where
correctnessis subjective. Is this email professional? Is this explanation clear? - RAG Systems: Failure might be retrieval (wrong documents), synthesis (wrong answer from right documents), or both. You must evaluate the entire pipeline.
Without rigorous evaluation, you can’t distinguish failure modes, prioritize improvements or know if changes help.
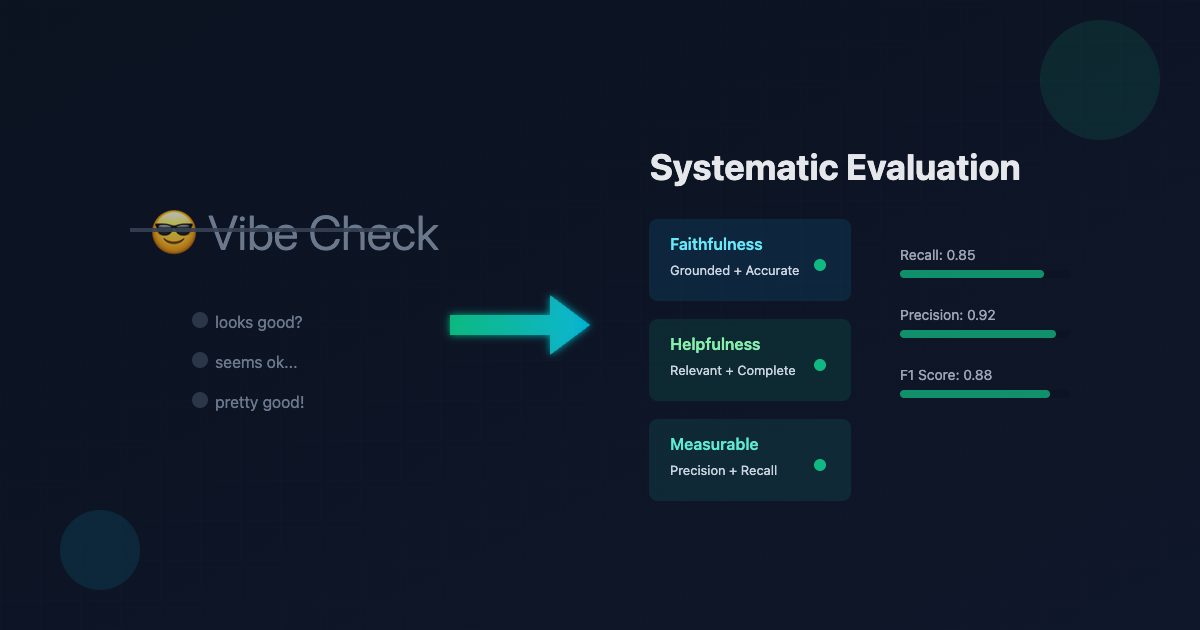
Three pillars of systematic evaluation
What to evaluate
A two-dimensional framework separating faithfulness (grounded and accurate) from helpfulness (relevant, comprehensive, concise). This distinction changes how you build datasets, choose metrics, and prioritize work.
How to evaluate
Survey the methods from code-based evaluators to LLM-as-a-Judge. When to use direct scoring versus pairwise comparisons, claim-based faithfulness verification, and the significant biases in LLM-evaluators you must mitigate.
Making it systematic
Applying the scientific method to evaluation, practicing eval-driven development, and maintaining continuous monitoring with human oversight for production systems.
Who this is for
ML practitioners: Comprehensive reference with evaluation methods, metrics selection, bias mitigation, and production practices. Includes decision trees, comparison tables, and implementation checklists.
Newcomers to LLM evals: Fundamentals-first approach explaining why LLM evaluation differs, core concepts with examples, progressing systematically to advanced techniques.
Building LLM systems is often easier than measuring if they work. This guide provides systematic approaches grounded in research and production experience.
Understanding Evaluation Dimensions: Faithfulness and Helpfulness
When you ask Is this LLM output good?, you’re actually asking two distinct questions:
- Is it grounded in facts? (Faithfulness)
- Is it useful to the user? (Helpfulness)
These dimensions are independent. An output can be perfectly faithful but unhelpful. Or helpful but unfaithful. The best LLM outputs nail both.
This two-dimensional framework changes everything about how you evaluate, build datasets, and prioritize improvements.
The two-dimensional framework for quality assessment
Faithfulness: Grounded and Accurate
Definition: Does the output stay grounded in the source material without adding unsupported claims?
Faithfulness means every claim in the response can be traced back to the provided context. It’s not about being generally correct—it’s about being verifiably correct from the given sources.
Example of faithful vs unfaithful:
Context: "The Q3 2024 report shows revenue of $2.1M, up 15% from Q2."

Faithful: "Q3 2024 revenue was $2.1M, representing a 15% increase from Q2."

Unfaithful: "Q3 2024 revenue was $2.1M, up 15% from Q2. This growth continues
the company's strong performance trend since its 2020 founding."
The second response adds unverified claims that aren’t in the source material—even if they happen to be true elsewhere.
Why it matters:
- Legal/Medical domains: Unfaithful outputs create liability. A medical chatbot can’t speculate beyond documented information.
- Enterprise RAG systems: Users need to trust responses are grounded in company documents, not hallucinated.
- Fact-checking applications: The entire purpose is verification against sources.
Distinguishing faithfulness from general correctness
An output can be factually correct but unfaithful. For example, if your LLM knows that Vizela is a city in Braga, Portugal, but the provided documents don’t mention this information, then stating “Vizela is a city in Braga, Portugal” would be unfaithful to that context**—**even though it’s true.
Faithfulness is about groundedness in provided sources, not general world knowledge.
Helpfulness: Relevant, Comprehensive, and Concise
Three sub-components in constant tension:
Relevance — Does it address what the user actually asked?
Question: "What's the return policy for electronics?"

Relevant: "Electronics can be returned within 30 days with original packaging..."

Irrelevant: "Our company was founded in 1995 and values customer satisfaction.
We offer many products including electronics, furniture, and clothing.
Electronics can be returned within 30 days..."
Comprehensiveness — Does it cover all important aspects?
Question: "How do I reset my password?"

Incomplete: "Click 'Forgot Password' on the login page."

Comprehensive: "Click 'Forgot Password' on the login page. Enter your email
address. Check your email for a reset link (may take 5 minutes). Click the link
and create a new password with at least 8 characters including a number and symbol."
Conciseness — Does it avoid unnecessary information?
Question: "What time does the store close?"

Concise: "The store closes at 9 PM daily."

Verbose: "Our store, which has been serving the community since 1995, closes
at 9 PM every day of the week. This closing time was established after careful
consideration of customer shopping patterns and employee work-life balance..."
The three-way tension:
- More comprehensive → less concise
- More concise → risk missing important details
- More relevant → might sacrifice completeness
Finding the right balance depends on your use case.
The inherent tension between faithfulness and helpfulness
Here’s where it gets interesting: faithfulness and helpfulness often conflict.
Scenario 1: High faithfulness, low helpfulness
Question: "What caused the 2008 financial crisis?"

Context: [A single paper discussing mortgage-backed securities]

Faithful but unhelpful: "I can only find information about mortgage-backed
securities. The document doesn't provide a complete picture of the crisis causes."

Helpful but unfaithful: "The 2008 financial crisis was caused by multiple factors:
subprime mortgages, mortgage-backed securities, credit default swaps, deregulation,
and global imbalances." [Adds information beyond the provided context]
The faithful response refuses to speculate. The helpful response gives a complete answer but goes beyond the source material.
Scenario 2: The “no information” dilemma
When the context doesn’t contain the answer, you face a choice:
- Maximize faithfulness: “I don’t have information to answer this question” (Type I error: false negative)
- Maximize helpfulness: Generate an answer anyway (Type II error: hallucination)
Neither option is universally correct. The right choice depends on domain priorities.
Domain-specific priorities
Different applications weigh these dimensions differently:
Faithfulness-prioritized domains:
- Legal: Contract analysis must stay strictly grounded in document text. Speculation creates liability.
- Medical: Diagnoses and treatment recommendations must be verifiable against medical literature.
- Compliance: Regulatory guidance must cite specific rules and regulations.
- Academic research: Citations must accurately reflect source material.
In these domains, an unhelpful but faithful response is better than a helpful but unfaithful one.
Helpfulness-prioritized domains:
- Consumer chatbots: Users want their questions answered, full stop. Strict groundedness might frustrate them.
- Creative writing assistants: Generating beyond provided context is the entire point.
- General Q&A: Users expect comprehensive answers drawing on model knowledge.
- Brainstorming tools: Helpfulness through broad ideation matters more than strict source grounding.
In these domains, moderate faithfulness tradeoffs for significantly better helpfulness might be acceptable.
Balanced domains:
Most production RAG systems need both. Enterprise search should be grounded in company docs (faithfulness) while providing complete, relevant answers (helpfulness).
Real-world example: E-commerce Product Support
| Use Case | Faithfulness Priority | Helpfulness Priority | Approach |
|---|---|---|---|
| Legal compliance chatbot | High | Medium | Must cite exact return policies from terms of service |
| Shopping assistant | Medium | High | Can synthesize across product reviews and specs |
| Technical support | High | High | Needs accurate troubleshooting + complete solutions |
Key takeaways
Faithfulness = Grounded in sources, verifiable, no hallucinations
Helpfulness = Relevant + Comprehensive + Concise
These dimensions often conflict—consciously choose priorities
Domain determines which matters more
Match evaluators to end users’ expectations
This framework guides everything: dataset building, metric selection, improvement prioritization.
Building Evaluation Datasets: The Foundation of Good Evals
Quality evaluation starts with quality data. You can’t build reliable evaluators without representative, well-annotated examples that capture the real challenges your system will face in production.
The hybrid approach to question generation
The most practical approach combines LLM generation with human refinement. Let LLMs draft questions at scale, then have humans polish them for quality. This gives you volume without sacrificing rigor.
The NarrativeQA insight: One of the most important lessons from research is to generate questions from summaries or abstracts rather than full documents.[^narrativeqa] When you generate questions from complete texts, you get shallow pattern-matching queries that can be answered by simple keyword lookups. Questions from summaries force deeper comprehension because the model must understand and synthesize information from the full document.
Consider a financial report example. If you generate questions directly from the full document, you might get: “What was Q3 revenue?” But generate from a summary, and you’re more likely to see: “How did the revenue growth rate compare to the increase in marketing spend?” The latter requires actual reasoning, not just finding numbers.
Diversity in question types matters immensely. Your evaluation dataset should include:
- Factual recall: “What was Q3 2024 revenue?” — tests basic information retrieval
- Multi-hop reasoning: “Calculate the total revenue increase from Q1 to Q3, given Q1 was 1.82M” — requires combining multiple facts
- Comparative: “Which department saw bigger budget changes: Marketing or R&D?” — demands synthesis across sections
- Inference: “What does the marketing spend increase suggest about company strategy?” — tests deeper understanding
- Counterfactual: “How would profitability change if marketing spend stayed flat?” — probes reasoning ability
Without this diversity, you’re testing only narrow capabilities and will miss critical failure modes.
Designing for robustness
Position bias is pervasive in long-context scenarios. Models often perform better when relevant information appears at the beginning or end of documents, struggling with information buried in the middle. This is called the “lost in the middle” problem, and it’s a real production concern.
Test for this systematically by creating variants of the same question where the evidence appears in different locations. Take a base document and place the critical information at the start, middle, and end. If your model’s accuracy drops significantly for middle-position evidence, you’ve identified a weakness that needs addressing.
Multi-hop questions are your secret weapon for identifying shallow reasoning. Single-hop questions like “What was Q3 revenue?” can often be answered by glorified search. Multi-hop questions force the model to synthesize information across sections, revealing whether it’s truly understanding or just matching patterns.
The distinction is subtle but critical. “What was Q3 revenue?” requires finding one fact. “Given Q1 revenue of 1.82M, what was the total increase by Q3?” requires finding Q3 revenue, performing arithmetic, and combining multiple data points. The second question tests capabilities the first doesn’t touch.
Human annotation: The discipline that makes or breaks evals
Calibration sessions are non-negotiable. Before full annotation begins, run calibration sessions where annotators label the same examples and discuss disagreements. This aligns everyone on what “faithful” and “helpful” actually mean in practice, not just in theory.
Your annotation guidelines should be concrete, not abstract. Instead of “label outputs as faithful or unfaithful,” provide decision rules:
-
Faithfulness: Every claim must trace to the document. If even one sentence contains unsupported information—even if factually correct from general knowledge—mark it UNFAITHFUL. When in doubt, mark FAIL and discuss.
-
Helpfulness: The response must be relevant (addresses the actual question), comprehensive (covers key points), and concise (no unnecessary verbosity). Missing any dimension means marking it as unhelpful.
The 50:50 balance is critical for training evaluator models. If your dataset has 90% good examples and 10% bad ones, models will learn to just predict “good” for everything and achieve 90% accuracy. Deliberately curate equal numbers of passing and failing examples so the model learns to discriminate.
Inter-annotator agreement quantifies annotation quality. Cohen’s kappa (κ) measures how much annotators agree beyond chance. Target κ > 0.60 for production use—anything lower suggests your guidelines are unclear or the task is too subjective.[^cohen-kappa]
Here’s how to interpret kappa scores:
| Cohen’s κ | Interpretation | Action |
|---|---|---|
| < 0.20 | Poor agreement | Fix your guidelines immediately |
| 0.21 - 0.40 | Fair agreement | Still needs significant work |
| 0.41 - 0.60 | Moderate agreement | Acceptable for research, marginal for production |
| 0.61 - 0.80 | Substantial agreement | Good for production |
| > 0.80 | Almost perfect agreement | Ideal but rare for subjective tasks |
If you’re below 0.60, don’t proceed to full annotation. Revisit your guidelines, add clarifying examples, and re-calibrate.
The practical checklist
Before considering your evaluation dataset complete, verify:
- Questions generated from summaries, not full texts — forces deeper comprehension
- Diverse question types — factual, multi-hop, inference, comparative, counterfactual
- Position bias testing — evidence at document start, middle, and end
- Balanced pass/fail distribution — 50:50 split for model training
- Clear annotation guidelines — concrete decision rules, not vague principles
- Measured inter-annotator agreement — Cohen’s κ > 0.60
- Human review of LLM-generated questions — aim for ~80% acceptance rate after refinement
Common Mistake: Skipping Dataset Quality Checks
Teams often rush to build evaluators without validating their dataset first. If your inter-annotator agreement is low (κ < 0.60), your evaluators will be unreliable no matter how sophisticated the method. Fix the foundation first.
Building evaluation datasets is tedious work. There’s no shortcut. But this foundation determines everything downstream—the quality of your evaluators, your ability to measure improvements, and ultimately whether users can trust your system. Get this right, and the rest becomes manageable. Skip it, and you’re building on sand.
Key Takeaways: Building Evaluation Datasets
Use LLMs to generate questions, humans to refine them
Generate from summaries, not full documents (forces deeper reasoning)
Include diverse question types (factual, multi-hop, comparative, inference)
Test for position bias systematically
Maintain 50:50 pass/fail balance
Target Cohen’s κ > 0.60 for inter-annotator agreement
Never skip calibration sessions
Evaluation Methods: From Traditional Metrics to LLM-as-Judge
Start simple, add complexity only when needed. The best evaluation approach is the simplest one that actually works for your use case.
Code-based evaluators: Your first line of defense
Before jumping to LLM-evaluators, implement straightforward programmatic checks. These are fast, deterministic, and completely transparent—you know exactly what they’re checking and why they pass or fail.
Format validation catches structural issues immediately. Does the response return valid JSON? Are required fields present? Is the output parseable? These checks cost nothing to run and catch obvious failures before they reach users.
Citation verification ensures your system is grounded. If your application requires references to source material, a simple regex can confirm citations are present. You’re not validating correctness yet—just that the system attempted to ground its response.
Length bounds prevent degenerate outputs. A response with 3 words probably didn’t answer the question. A response with 5,000 words for “What time does the store close?” is clearly broken. Sanity-check that outputs fall within reasonable ranges.
Consistency checks validate internal logic. If your system returns confidence scores, do they sum to 1.0? If it provides a numerical answer, does it match the format specified? These deterministic checks catch bugs that LLM-evaluators might miss.
The principle here is simple: use the simplest approach that works. Code-based checks are fast, cheap, and reliable. Don’t reach for complex LLM evaluation when a 5-line function solves the problem.
When code-based evaluation is sufficient:
| Check Type | Example | Cost | Speed |
|---|---|---|---|
| Format validation | JSON structure, required fields | Free | Instant |
| Length constraints | 10-500 words for summaries | Free | Instant |
| Citation presence | Contains [1], [2] references | Free | Instant |
| Regex patterns | Email format, date format | Free | Instant |
| Consistency checks | Confidence scores sum to 1.0 | Free | Instant |
LLM-evaluators: Three core approaches
When you need semantic understanding—when correctness depends on meaning, not just structure—LLM-evaluators become necessary. But not all LLM evaluation methods are created equal.
Direct scoring: Best for objective assessments
Direct scoring means giving the LLM a single output and asking it to judge quality. This works well for relatively objective criteria where there’s a clear right or wrong answer.
Faithfulness evaluation is the canonical example. You provide the context, the generated answer, and ask: “Is every claim in this answer supported by the context?” This is verifiable—either the claims trace back to the source or they don’t.
The key is being specific about what you’re evaluating. Don’t ask “Is this output good?”—that’s too vague and subjective. Ask “Does this answer contain any unsupported claims?” or “Does this response answer the question that was asked?” Give the LLM concrete, verifiable criteria.
When direct scoring works well:
- Faithfulness (groundedness in source material)
- Toxicity detection (clear policy violations)
- Format correctness (follows specified structure)
- Policy compliance (adheres to defined rules)
- Binary questions with objective answers
Limitations: Direct scoring struggles with subjective qualities. Is this explanation “clear”? Is this email “professional”? Different evaluators—human or LLM—will disagree substantially on these judgments.
Pairwise comparison: More reliable for subjective quality
Pairwise comparison asks the LLM to choose which of two responses is better. This is consistently more reliable than direct scoring for subjective assessments.[^judging-llm-judge]
Why does pairwise work better? Comparative judgments are easier than absolute ones. It’s hard to say “This email is 7/10 professional,” but easy to say “Email A is more professional than Email B.” Humans and LLMs both make more consistent judgments when comparing directly.
This approach is essential for A/B testing. You’re not asking “Is variant B good?”—you’re asking “Is variant B better than our baseline A?” That’s the question that actually matters for shipping decisions.
The critical detail: position bias mitigation. LLMs exhibit strong position bias, preferring the first response 50-70% of the time regardless of quality.[^position-bias] This isn’t subtle—it’s a massive systematic error that invalidates naive pairwise evaluation.
The solution is simple but non-negotiable: evaluate both orderings. Compare A then B, then compare B then A. If the LLM picks A in the first comparison and A in the second (when A is in the second position), you have high confidence A is actually better. If results flip based on position, you’ve detected bias and should treat it as a tie or require human review.
When pairwise comparison excels:
- Subjective quality assessments (coherence, clarity, persuasiveness)
- A/B testing (comparing system variants)
- Ranking outputs (determining relative quality)
- Cases where absolute scoring is unreliable
Limitations: Requires reference responses to compare against. Can’t use pairwise when you only have one output. And you must run both orderings, doubling evaluation cost.
Reference-based evaluation: When you have gold standards
Reference-based evaluation compares generated outputs to human-written gold standards. If you have high-quality reference answers, this is powerful—you’re measuring how closely the system matches expert judgment.
The LLM evaluator assesses whether the generated answer captures the key information from the reference. Not word-for-word matching (that’s what BLEU does, and we’ve established it fails for LLMs), but semantic alignment.
This works when references are available and high-quality. In practice, that’s rarer than you’d hope. Creating good reference answers is expensive—it requires domain experts, careful review, and ongoing maintenance as your system evolves.
When reference-based makes sense:
- You have expert-written gold standard answers
- The task has relatively deterministic correct answers
- You can afford ongoing reference maintenance
- You’re evaluating research systems with curated datasets
Limitations: Expensive to create and maintain references. May penalize valid alternative answers that differ from the reference but are equally correct.
Advanced prompting techniques for better evaluation
Once you’ve chosen direct scoring, pairwise, or reference-based evaluation, you can improve accuracy through better prompting.
Chain-of-Thought: Reasoning before judging
Chain-of-Thought (CoT) prompting asks the LLM to explain its reasoning before rendering judgment. Instead of jumping directly to “FAITHFUL” or “UNFAITHFUL,” you ask it to think step-by-step.
For faithfulness evaluation, this looks like:
- List all claims in the answer
- For each claim, find supporting evidence in the context
- Mark any unsupported claims
- Final verdict: FAITHFUL or UNFAITHFUL
Research shows CoT improves accuracy by 10-15% across various evaluation tasks.[^geval] The tradeoff is clear: you’re doubling latency and cost because the LLM must generate reasoning text before the final judgment. For high-stakes production evaluation, this is often worth it. For rapid iteration during development, the overhead may be prohibitive.
Few-shot prompting: Learning by example
Few-shot prompting provides example evaluations before asking the LLM to judge new cases. This is especially powerful when your evaluation criteria are nuanced or domain-specific.
Instead of just defining “faithful,” you show examples:
- Example 1: Context says “Revenue was 2M in Q3.” Answer says “Q3 revenue was 2M.” → FAITHFUL (exact match)
- Example 2: Context says “Revenue was 2M in Q3.” Answer says “Q3 revenue was 2M, up 20% YoY.” → UNFAITHFUL (YoY claim unsupported)
The LLM learns the boundaries of your criteria from examples, not just abstract definitions. This typically improves consistency and accuracy, especially for edge cases.
The challenge is selecting good examples. They should cover common failure modes, clarify ambiguous cases, and represent the diversity of your data. Poor examples can bias the evaluator or teach the wrong lessons.
Cross-examination: Multi-turn probing for high-recall detection
Cross-examination uses multi-turn dialogue to probe for issues. Instead of a single evaluation pass, you have the LLM evaluator question the response multiple times, digging deeper with each round.
This achieves significantly higher recall on defect detection—catching 75-84% of hallucinations compared to 30-60% for single-pass evaluation. The reason is intuitive: subtle inconsistencies or unsupported claims often require multiple angles of inquiry to surface.
The cost is substantial: 3-5x more expensive than single-pass evaluation due to multiple LLM calls. Reserve this for critical production monitoring or high-stakes domains where missing a hallucination has serious consequences.
When to use cross-examination:
- Legal or medical domains (high consequence of errors)
- Final production monitoring (cost justified by importance)
- Investigating specific failure cases in detail
When to skip it:
- Rapid development iteration (too slow and expensive)
- High-volume evaluation (cost prohibitive)
- Lower-stakes applications (single-pass sufficient)
Choosing your evaluation method: A practical guide
The decision tree is simpler than it appears:
Start with code-based checks for anything deterministic. Format validation, length bounds, citation presence, consistency rules. These catch obvious issues at zero cost.
Use direct scoring with LLM-evaluators for objective semantic judgments. Faithfulness, toxicity, policy compliance—cases where there’s a verifiable ground truth.
Switch to pairwise comparison for subjective quality. Coherence, clarity, professionalism—anything where absolute scoring is unreliable but relative comparison works.
Add reference-based evaluation only if you have high-quality gold standards and can maintain them.
Layer on CoT prompting when accuracy matters more than cost. Development and critical production use cases.
Use few-shot examples when criteria are nuanced or domain-specific. Complex evaluation tasks benefit from learning by example.
Reserve cross-examination for high-stakes production monitoring where missing errors is costly.
The pattern is clear: start simple, add complexity only where it demonstrably improves results. Every additional technique trades cost and latency for accuracy. Make those trades consciously based on your actual requirements, not what sounds sophisticated.
Key Takeaways: Evaluation Methods
Start with code-based checks (free, fast, deterministic)
Use direct scoring for objective criteria (faithfulness, compliance)
Use pairwise comparison for subjective quality (always mitigate position bias!)
Add CoT when accuracy > cost (10-15% improvement, 2x latency)
Use few-shot for nuanced criteria (domain-specific evaluation)
Reserve cross-examination for high-stakes domains (3-5x cost, 75-84% recall)
Evaluation Metrics: Measuring What Matters
Choose metrics based on your evaluation goals and task type. The right metric answers the operational question you actually care about.
Classification metrics for production
Classification metrics are most actionable for production systems—they directly answer operational questions that drive decisions.
When you evaluate LLM outputs as pass/fail (faithful/unfaithful, helpful/unhelpful, safe/unsafe), you’re doing binary classification. The standard metrics apply: precision, recall, F1, and accuracy. But which one matters depends entirely on your use case.
Precision answers: “When my evaluator flags an output as bad, how often is it actually bad?” High precision means few false alarms. Your team isn’t wasting time investigating false positives.
Recall answers: “What percentage of truly bad outputs does my evaluator catch?” High recall means you’re not missing problems. Users aren’t seeing failures that slipped through.
F1 balances both: It’s the harmonic mean of precision and recall. Use it when you need both to be reasonably good and don’t have a strong preference for one over the other.
Accuracy is usually misleading for evaluation tasks. If 95% of your outputs are good, an evaluator that always predicts “good” gets 95% accuracy while catching zero problems. Accuracy only makes sense when your dataset has balanced pass/fail distribution.
The critical insight: different use cases demand different metric priorities.
| Use Case | Priority Metric | Target | Why |
|---|---|---|---|
| Guardrail systems | Recall | > 0.95 | Must catch harmful outputs; false positives acceptable |
| Ranking systems | Precision | > 0.85 | Only promote quality; false negatives acceptable |
| Monitoring systems | F1 Score | > 0.75 | Balance both; avoid alert fatigue |
Guardrail systems prioritize recall. You’re preventing harmful outputs from reaching users. Missing a toxic response is catastrophic; a false positive just means one extra human review. You need to catch 95%+ of problems even if that means flagging some good outputs.
Ranking systems prioritize precision. You’re ordering results by quality to show users the best responses first. A false positive means showing a bad result prominently, degrading user experience. Better to be conservative and only promote responses you’re confident are good.
Monitoring systems need balance. You’re tracking system health over time. Low recall means problems go undetected. Low precision means alert fatigue—your team starts ignoring notifications because most are false alarms. F1 score is usually the right target here.
AUROC (Area Under ROC Curve) is useful when you have confidence scores, not just binary predictions. It measures how well your evaluator separates good from bad across all possible thresholds. AUROC of 0.90+ indicates strong discriminative ability.
Common Mistake: Trusting Accuracy Alone
Accuracy of 95% sounds great, but if your data is 95% positive examples, a model that always predicts “positive” gets 0.95 accuracy while being useless. Always check precision and recall separately for imbalanced data.
Correlation metrics for alignment
Correlation metrics measure how well LLM-evaluators agree with human judgment. These are common in research but less actionable for production than classification metrics.
Cohen’s kappa is the gold standard for measuring agreement. Unlike simple percent agreement, kappa adjusts for chance agreement.[^cohen-kappa] Two evaluators who randomly guess will occasionally agree just by luck—kappa accounts for this.
The interpretation scale is well-established:
| Cohen’s κ | Interpretation | Action |
|---|---|---|
| < 0.20 | Poor agreement | Fix guidelines immediately |
| 0.21 - 0.40 | Fair agreement | Needs significant work |
| 0.41 - 0.60 | Moderate agreement | Marginal for production |
| 0.61 - 0.80 | Substantial agreement | Good for production |
| > 0.80 | Almost perfect agreement | Ideal (rare for subjective tasks) |
Target kappa > 0.60 for production use. Below this threshold, your LLM-evaluator is insufficiently aligned with human judgment to be trustworthy. Above 0.60, you have substantial agreement—good enough for most applications.
Spearman’s rho and Kendall’s tau measure correlation for ranked or scored data. If humans rate outputs on a 1-5 scale and your LLM-evaluator does the same, these metrics tell you how well the rankings correlate.
The problem: they don’t adjust for chance agreement. Two random rankings will show some positive correlation just by luck. This leads to overoptimistic estimates compared to kappa.
Use Cohen’s kappa whenever possible. It’s more conservative and more honest about agreement. Reserve Spearman’s rho and Kendall’s tau for cases where kappa doesn’t apply—continuous scores rather than discrete categories.
Metric selection decision tree
The metrics you should actually track
In production, track these metrics continuously:
For your LLM system outputs:
- Failure rate: Percentage flagged by evaluators
- Category breakdown: Faithfulness failures vs helpfulness failures
- Temporal trends: Is quality improving or degrading?
- User feedback alignment: Do users agree with evaluator judgments?
For your evaluators themselves:
- Recall on validation set: Performance on known failure cases with ground truth
- Precision on production samples: Human review of flagged outputs
- Cohen’s kappa vs humans: Monthly calibration checks
- Consistency over time: Are judgments stable?
The pattern is clear: choose metrics that answer your actual operational questions. “Is my system catching harmful outputs?” needs recall. “Are my quality rankings trustworthy?” needs precision. “Is my evaluator aligned with human judgment?” needs Cohen’s kappa.
Don’t report metrics because they’re common in papers. Report metrics that drive decisions. If a metric going up or down doesn’t change what you do, stop tracking it.
Key Takeaways: Evaluation Metrics
Choose metrics based on operational questions, not what sounds sophisticated
Guardrails → Recall (catch all failures)
Ranking → Precision (avoid false positives)
Monitoring → F1 (balance both)
Evaluator alignment → Cohen’s κ > 0.60
Track both system outputs AND evaluator quality
Known Limitations and Biases in LLM-Evaluators
LLM-evaluators are powerful but not perfect. Understanding their limitations is critical for proper use in production systems.
The performance reality check
LLM-evaluators correlate moderately with humans, but significant gaps remain. This isn’t a minor caveat—it’s a fundamental limitation that shapes how you should deploy these tools.
Human annotators typically achieve 0.80-0.90 inter-annotator agreement (measured by Cohen’s kappa) on well-defined tasks. LLM-evaluators achieve 0.30-0.60 correlation with human judgment—substantially lower.[^llm-bias] This means LLM-evaluators miss patterns humans catch and sometimes flag issues humans don’t see.
Recall on defect detection is particularly concerning. When researchers test LLM-evaluators’ ability to catch factual inconsistencies and hallucinations, they find 30-60% recall in single-pass evaluation. Your evaluator is missing 40-70% of actual problems. Cross-examination techniques can push this to 75-84%, but at 3-5x the cost.
The implication: LLM-evaluators are not a replacement for human oversight in critical domains. They’re a scaling mechanism that catches some issues automatically, flagging candidates for human review. Treat them as a first-pass filter, not a final arbiter.
Systematic biases you must address
LLM-evaluators exhibit predictable, measurable biases. These aren’t occasional quirks—they’re systematic patterns that corrupt evaluation if left unmitigated.
Position bias: The 50-70% first-position preference
Position bias is the most severe and well-documented issue in pairwise comparison.[^position-bias] LLMs prefer whichever response appears first in the prompt 50-70% of the time, regardless of actual quality.
This isn’t subtle. If you run naive pairwise evaluation without mitigation, your results are dominated by prompt ordering rather than quality differences. You’ll think variant A is better when it’s actually just appearing first more often.
The research is unambiguous: multiple studies across different models and tasks consistently find this bias.[^judging-llm-judge][^portia] It affects GPT-4, Claude, Llama, and every other model tested. It’s not going away.
Mitigation is non-negotiable: Evaluate both orderings (A then B, B then A) and aggregate results. If judgments flip based on position, treat it as a tie or flag for human review. This doubles evaluation cost but it’s the only way to get valid results.
Verbosity bias: Preferring longer responses over 90% of the time
LLM-evaluators systematically prefer longer responses, even when the shorter response is objectively better. In controlled tests with identical content at different lengths, longer versions win over 90% of the time.[^llm-bias]
This creates perverse incentives. If your system learns that verbose outputs score higher with LLM-evaluators, it will generate unnecessarily long responses. Users get worse experiences while your metrics claim improvement.
The problem compounds with pairwise comparison. When comparing a concise, complete answer to a verbose, rambling one with the same information, LLM-evaluators favor verbosity. This directly contradicts the “conciseness” criterion in helpfulness.
Mitigation strategies:
- Evaluate based on specific criteria (faithfulness, relevance, completeness) rather than vague “overall quality”
- Use reference-based evaluation when you have concise gold standards
- Add explicit length penalties in your evaluation rubric
- Monitor response length distributions over time—increasing length may signal verbosity bias
Self-enhancement bias: 10-25% higher win rates for own outputs
Models rate their own outputs more favorably than competing models’ outputs. When GPT-4 evaluates GPT-4 vs Claude outputs, GPT-4 wins ~60% of pairwise comparisons. When Claude evaluates the same pairs, Claude wins ~55%.[^llm-bias]
This 10-25% self-preference isn’t explained by objective quality differences—it’s systematic bias. Using the same model for generation and evaluation inflates your quality estimates.
The solution is simple: use a third-party model for evaluation. If your production system uses GPT-4, evaluate with Claude or vice versa. This adds cost and complexity, but it’s necessary for unbiased assessment.
Over-reasoning: Injecting background knowledge and excessive critique
LLM-evaluators often bring in information beyond the provided context, similar to how they hallucinate in generation tasks. When evaluating faithfulness, they might mark an answer as correct because they know it’s true from training data—even though it’s not supported by the given context.
They also nitpick more than humans do. An LLM-evaluator might flag missing Oxford commas, outdated terminology, or edge cases not mentioned in the question. Human evaluators focus on whether the response answers the question adequately; LLM-evaluators sometimes apply unrealistic standards.
Example contrast:
- Human critique: “Answer is mostly accurate but could be more concise.”
- LLM critique: “The answer is technically correct but exhibits several issues: 1) Verbose phrasing in paragraph 2, 2) Missing Oxford comma in line 3, 3) Could elaborate on edge case X (not mentioned in question), 4) Terminology Y is outdated, prefer Z…”
Mitigation approaches:
- Use highly specific evaluation prompts that constrain reasoning to provided materials
- Add explicit instructions: “Only consider information in the given context”
- Few-shot examples showing appropriate vs excessive critique
- Human calibration to identify when LLM-evaluators are too strict
Finetuned models: The specialization tradeoff
Finetuned evaluator models like Prometheus achieve strong performance on specific tasks but generalize poorly.[^finetuned-eval] Train a model to evaluate summarization quality, and it excels at that narrow task. Ask it to evaluate dialogue coherence, and performance collapses.
The performance delta is dramatic:
| Task Type | Correlation with Humans | Assessment |
|---|---|---|
| Trained task | κ: 0.85 | Excellent |
| Similar task | κ: 0.65 | Substantial degradation |
| Different task | κ: 0.35 | Catastrophic failure |
This is the opposite of general-purpose API models like GPT-4 or Claude, which maintain reasonable performance across diverse evaluation tasks even without task-specific training.
When to finetune evaluators:
- High-volume single task (millions of evaluations make training cost worthwhile)
- Task-specific rubrics available (clear training signal)
- Don’t need cross-domain generalization (narrow scope acceptable)
- Have resources for ongoing model maintenance
When to use API models:
- Multiple evaluation tasks (flexibility needed)
- Evolving requirements (rubrics changing)
- Need quick iteration (no retraining overhead)
- Limited ML infrastructure (leverage external providers)
The tradeoff is clear: finetuned models optimize for narrow excellence; API models optimize for broad capability. Choose based on your deployment reality, not what sounds more sophisticated.
Living with imperfect evaluators
The limitations and biases documented here aren’t reasons to avoid LLM-evaluators—they’re reasons to use them carefully with eyes open.
Key principles for production deployment:
- Layer human oversight: Use LLM-evaluators for volume, humans for verification and calibration
- Measure and monitor bias: Track position bias, length distributions, self-enhancement effects
- Mitigate systematically: Implement both-orderings, third-party models, specific criteria
- Calibrate regularly: Monthly checks of LLM-evaluator vs human judgment (target κ > 0.60)
- Start conservative: Use LLM-evaluators for flagging candidates, not final decisions
The goal isn’t perfect evaluation—that’s impossible even with humans. The goal is good enough evaluation at scale with known and managed limitations. Understanding biases is the first step toward building systems that work despite them.
Key Takeaways: Limitations and Biases
LLM-evaluators have 0.30-0.60 agreement with humans (vs 0.80-0.90 human-human)
Single-pass recall is only 30-60% for defect detection
Position bias affects 50-70% of pairwise comparisons → mitigate with both orderings
Verbosity bias favors longer responses 90%+ of the time → use specific criteria
Self-enhancement bias inflates own-model scores by 10-25% → use third-party evaluators
Over-reasoning injects external knowledge → constrain evaluation scope
Finetuned models excel at narrow tasks, fail at generalization
The Evaluation Process: Making It Systematic
Tools alone won’t save your product. Disciplined process is essential.
The scientific method applied to evaluation
The “secret sauce” for building production evals: it’s just the scientific method. No magic, no proprietary frameworks—systematic application of observe, hypothesize, experiment, measure, iterate.
Phase 1: Observe. Where does your system fail? Examine production outputs, user complaints, spot-checks. Look for patterns—are failures random or clustered? Do certain query types consistently break? Does performance degrade with document length?
Don’t skip this. Many teams jump straight to “solutions” without understanding what’s actually wrong. Observation grounds everything that follows.
Phase 2: Annotate. Label 50-100 examples as pass/fail based on your quality criteria. This forces you to operationalize vague notions of “good” into concrete judgments. Can multiple annotators agree? If not, your criteria are too subjective or poorly defined.
Maintain 50:50 pass/fail balance. You need both positive and negative examples to train evaluators and measure progress. A dataset of all good examples tells you nothing about failure detection.
Phase 3: Hypothesize. Based on observed patterns, form testable hypotheses about why failures occur. “Multi-hop questions fail because retrieval returns single passages” is testable. “The model isn’t smart enough” is not.
Good hypotheses have clear success criteria. “Increasing retrieval k from 3 to 5 will improve multi-hop accuracy by at least 10 percentage points.” Now you know exactly what to test and how to measure success.
Phase 4: Experiment. Test your hypothesis with controlled changes. Establish a baseline metric before making changes. Try the intervention. Measure again. Did the metric move in the predicted direction? By how much?
Critical principle: change one thing at a time. If you simultaneously increase retrieval k, add reranking, and switch models, you won’t know which change drove improvement (or degradation).
Phase 5: Measure. Quantify outcomes with statistical rigor. Is the 10-point accuracy improvement significant or within noise? Use confidence intervals, p-values, or bootstrapping—whatever’s appropriate for your data size.
Never ship based on “it seems better.” That’s a vibe check. You need numbers that withstand scrutiny.
Then iterate. Measuring outcomes often reveals new failure modes you hadn’t noticed. The loop continues. This isn’t a one-time project—it’s ongoing practice.
Example workflow in action
Here’s what this looks like concretely:
Observe: 40% of multi-hop questions fail. Single-hop questions are fine. Failures cluster around queries requiring synthesis across document sections.
Annotate: Label 100 multi-hop examples. 30 are hallucinations (answer includes unsupported claims), 10 are incomplete (missing key information from second passage).
Hypothesize: “Retrieval returns single passages. Multi-hop questions need 2+ passages for complete answers. Increasing k from 3 to 5 and adding reranking will improve accuracy from 40% to 65%.”
Experiment:
- Baseline: k=3, no reranking → 40% accuracy
- Test 1: k=5, no reranking → 52% accuracy
- Test 2: k=5, with reranking → 65% accuracy
Measure: Improvement is 25 percentage points (p < 0.01), exceeding the 10-point threshold. Ship the change.
Iterate: New observation—accuracy drops for questions about information near document end. Hypothesis: retrieval has recency bias. Next experiment cycle begins.
This is what systematic evaluation looks like. Not magic, not complex tooling—just disciplined application of scientific method.
Eval-Driven Development (EDD)
Write evals before building features. This inverts the traditional flow and forces clarity upfront.
Traditional approach:
- Build feature based on intuition
- Test manually with a few examples
- Ship if it “looks good”
- Hope users don’t find issues
Problems: No objective criteria. No way to measure improvement. Scope creep because requirements were never explicit. You discover problems after shipping.
Eval-Driven Development:
- Write evaluation dataset defining success
- Measure baseline performance
- Build/improve system
- Run evals after every significant change
- Ship only when evals pass threshold
Benefits: Forced clarity upfront—you must define “good” before building. Measurable progress at every step. No scope creep—evals are the spec. Catch problems before users see them.
Example success criteria:
| Dimension | Metric | Threshold | Why |
|---|---|---|---|
| Faithfulness | Recall | > 0.85 | Catch 85%+ of hallucinations |
| Helpfulness | Score | > 0.80 | 80%+ helpful responses |
| Latency | P95 | < 500ms | User experience requirement |
| User satisfaction | Stars | > 4.0 | Business success metric |
These aren’t aspirational—they’re gates. Your feature doesn’t ship until evals pass. This prevents the classic trap: “We’ll improve quality after launch” (which never happens because you’re on to the next feature).
EDD works because it makes trade-offs explicit. Want to ship faster? Lower the threshold or reduce eval coverage—but do it consciously, understanding the quality implications.
Continuous monitoring with human-in-the-loop
Production evaluation requires ongoing vigilance. Neither automated evaluators nor human reviewers are sufficient alone—you need both in a structured feedback loop.
The three-tier monitoring system
Tier 1: Human sampling (daily/weekly). Manually review 50-100 production outputs. This serves multiple purposes:
- Establish ground truth for calibration
- Catch edge cases automated evaluators miss
- Stay connected to actual user experience
- Identify emerging failure patterns
Sample randomly, but oversample flagged outputs to verify your evaluators aren’t crying wolf. If 80% of flagged outputs are actually fine, you have precision problems.
Tier 2: Calibrate evaluators (monthly). Compare LLM-evaluator judgments against human annotations from Tier 1. Calculate recall (what percentage of actual failures did the evaluator catch?) and Cohen’s kappa (overall agreement).
Target thresholds:
- Recall > 0.70 for faithfulness evaluation
- Cohen’s κ > 0.60 for helpfulness evaluation
Below these thresholds, your evaluators aren’t trustworthy. Refine prompts, add few-shot examples, or switch to better models. Then re-calibrate.
Tier 3: Scaled monitoring (continuous). Run automated evaluators on all production outputs. Flag issues for human review. Track failure rates, category breakdowns, and temporal trends.
The key insight: automation provides coverage, humans provide accuracy. Spot-check flagged outputs to ensure precision stays high. Investigate unflagged outputs periodically to catch recall gaps.
Why the hybrid approach is non-negotiable
Neither humans nor LLM-evaluators are perfect. The table tells the story:
| Evaluator Type | Strengths | Weaknesses | Role |
|---|---|---|---|
| Automated | Scale, consistency, speed, 24/7 operation | Biases, limited recall (30-60%), misses subtle issues | Volume monitoring, first-pass filtering |
| Human | Nuanced judgment, catches edge cases, domain expertise | Expensive, inconsistent, doesn’t scale, subjective | Calibration, spot-checks, complex cases |
| Hybrid | Best of both—scale + accuracy | Requires organizational discipline | Production standard |
Production reality: You’ll process thousands or millions of outputs. Humans can’t review them all. But automated evaluators miss 40-70% of issues in single-pass mode. The solution is the feedback loop:
- Humans review samples → establish ground truth
- Calibrate automated evaluators → measure alignment
- Automated evaluators flag candidates → scale coverage
- Humans spot-check flags → verify precision
- Update evaluators based on findings → continuous improvement
Organizational discipline: The unsexy necessity
Success requires maintaining consistent feedback loops. No tool compensates for lack of discipline.
Common failure modes:
Tool-thinking trap: “We bought the best LLM-evaluator, we’re done.” Tools are commodities. Process is the differentiator.
Trusting automation blindly: “The evaluator flagged it, ship the fix.” Did you verify the flag was correct? Or chase a false positive?
Vibe-check culture: “The new prompt feels better.” Does your data agree? Or are you fooling yourself?
Static eval mindset: “We ran evals at launch.” How do you know quality hasn’t degraded? Continuous monitoring or it didn’t happen.
Skipping baselines: “Let’s try this new approach!” Compared to what? Measure before and after or you’re flying blind.
Required practices:
Process over tools: Scientific method > any specific evaluator. The framework is system-agnostic.
Human-in-the-loop: Weekly sampling, monthly calibration. Non-negotiable for production systems.
Measurement first: Track metrics before and after every change. Decisions driven by data, not intuition.
Continuous improvement: Evals evolve with your product. Last quarter’s eval dataset doesn’t capture this quarter’s failures.
Hypothesis-driven: Every change tests a specific hypothesis with clear success criteria. No “let’s try this and see.”
The data flywheel
When you do this right, a virtuous cycle emerges:
Measurement reveals problems → improvements fix them → defects decrease → users trust the system more → you can invest in harder problems because the basics work.
This flywheel requires consistent effort. Miss a calibration cycle, skip baseline measurements, stop human sampling—the wheel stops spinning. Momentum evaporates.
Practical implementation checklist
Are you actually doing systematic evaluation? Check yourself:
- Regular sampling: Weekly/daily production output review by humans
- Annotation consistency: Inter-annotator agreement measured (κ > 0.60)
- Evaluator calibration: Monthly LLM-evaluator vs human judgment comparison
- Hypothesis-driven changes: Every modification tests specific hypothesis with clear success criteria
- Baseline measurement: Always measure before making changes
- Statistical rigor: Use p-values, confidence intervals—not gut feelings
- Continuous monitoring: Automated evaluation running on production outputs
- Feedback loops: Human findings improve evaluators, evaluator findings trigger human review
If you can’t check most of these boxes, you’re not doing systematic evaluation—you’re doing vibe checks at scale.
The bottom line
Building LLM systems can feel like magic, but building reliable LLM products still takes elbow grease. The evaluation bottleneck is real, but it’s solvable through disciplined process:
Process matters more than tools:
- Scientific method > any specific evaluator
- EDD > ad-hoc testing
- Human-in-the-loop > fully automated
- Continuous improvement > one-time evaluation
The teams shipping trustworthy LLM products aren’t using secret tools or magic techniques. They’re applying boring, systematic evaluation practices with organizational discipline. That’s the unsexy truth.
Key Takeaways: The Evaluation Process
Apply the scientific method: observe → annotate → hypothesize → experiment → measure → iterate
Practice eval-driven development (write evals before building features)
Implement three-tier monitoring: human sampling → evaluator calibration → scaled automation
Maintain feedback loops: continuous improvement, not one-time setup
Organizational discipline > fancy tools
Measure everything, ship based on data not vibes
Conclusion: Evaluation as Continuous Practice
Evaluation isn’t a solved problem—it’s an evolving practice requiring ongoing attention and discipline.
The three pillars reviewed
What to evaluate: Faithfulness vs helpfulness. These dimensions often conflict, and you must consciously choose priorities based on domain needs. Legal and medical applications prioritize faithfulness—speculation creates liability. Consumer chatbots may prioritize helpfulness—users want complete answers. Most production systems need both, carefully balanced.
The framework itself is simple: faithfulness means grounded in sources without unsupported claims; helpfulness means relevant, comprehensive, and concise. But applying it requires judgment. When context is incomplete, do you refuse to answer (maximize faithfulness) or generate anyway (maximize helpfulness)? There’s no universal right answer—it depends on your users and domain.
How to evaluate: Start simple, add complexity deliberately. Code-based evaluators for deterministic checks. Direct scoring with LLMs for objective semantic judgments like faithfulness. Pairwise comparison for subjective quality assessments. Reference-based when you have gold standards.
Layer on advanced techniques—Chain-of-Thought, few-shot prompting, cross-examination—only where they demonstrably improve results. Every technique trades cost and latency for accuracy. Make those trades consciously based on your requirements, not what sounds sophisticated in papers.
Understand and mitigate systematic biases. Position bias corrupts pairwise comparison without both-orderings evaluation. Verbosity bias rewards unnecessarily long outputs. Self-enhancement bias inflates quality when using the same model for generation and evaluation. These aren’t edge cases—they’re pervasive, documented patterns that invalidate naive evaluation.
Making it systematic: Process over tools. Apply the scientific method: observe failures, annotate examples, hypothesize causes, experiment with fixes, measure outcomes, iterate. Practice eval-driven development—write evals before building features. Maintain continuous monitoring with three-tier human-in-the-loop systems.
The unsexy truth: organizational discipline matters more than any specific tool or technique. Weekly human sampling, monthly evaluator calibration, hypothesis-driven changes, baseline measurements before modifications. These boring practices separate teams shipping trustworthy products from teams chasing vibe checks.
Core principles distilled
If you remember nothing else from this guide, remember these principles:
Process over tools. The scientific method beats any specific evaluator. Teams succeed through disciplined practices, not magic frameworks.
Balance automation with human judgment. Scale monitoring with LLM-evaluators, calibrate quality with human review. Neither alone is sufficient.
Measure everything. If you can’t measure it, you can’t improve it. Track baselines before changes. Use statistical rigor, not gut feelings.
Domain expertise matters. Expert human judgment beats crowd workers for specialized domains. LLM-evaluators correlate moderately with humans but miss patterns domain experts catch.
Evaluation is practice, not artifact. You don’t “finish” evaluation and move on. Requirements evolve, failure modes shift, systems drift. Continuous improvement is the standard.
Bias awareness is mandatory. LLM-evaluators have systematic biases—position preference, verbosity bias, self-enhancement. Mitigate them consciously or get corrupted results.
Start simple, prove value, scale deliberately. Don’t architect elaborate evaluation systems upfront. Build a 50-example eval dataset. Run simple evaluators. Measure alignment with your judgment. Expand as you learn what works.
Moving beyond vibe checks
The evaluation bottleneck is real. You’ve built an LLM-powered feature, tested it manually, shown it to colleagues who nod approvingly. But you don’t actually know if it works reliably. Users report hallucinations, irrelevant responses, other failures. You were relying on vibes, not measurements.
This guide provides the systematic approaches to escape that trap. The techniques aren’t revolutionary—they’re borrowed from decades of ML research and production experience. What’s new is applying them systematically to LLM evaluation.
Building LLM systems is often easier than measuring if they work. Generation feels like magic; evaluation feels like drudgery. But evaluation is how you transform prototypes into trustworthy products users can rely on.
The good news: evaluation isn’t magic either. It’s systematic application of the scientific method, disciplined annotation practices, continuous monitoring with human oversight. It takes work—elbow grease, not genius—but the payoff is products users trust.
Your starting point
Don’t try to implement everything at once. Start here:
Week 1-2: Build your first eval dataset
- Collect 50-100 production examples (or generate synthetic ones)
- Manually label them as pass/fail
- Balance 50:50 between passing and failing examples
- Document what makes outputs good vs bad
Week 3: Implement simple evaluators
- Code-based checks for format, length, citation presence
- Basic LLM-evaluator for faithfulness (direct scoring)
- Measure how often the LLM-evaluator agrees with your labels
Week 4: Establish baselines and iterate
- Measure current system performance on your eval dataset
- Identify the biggest failure mode
- Form a hypothesis about the cause
- Test a fix and measure improvement
Month 2 onward: Scale and systematize
- Expand eval dataset to 200-500 examples
- Add diverse question types and position bias tests
- Implement pairwise comparison for quality assessment
- Start weekly human sampling of production outputs
- Monthly calibration: LLM-evaluator vs human judgment
You don’t need sophisticated tooling to start. A spreadsheet, a Python script, and disciplined sampling will take you far. Add complexity only when simple approaches prove insufficient.
The path forward
Evaluation is evolving rapidly. New techniques emerge, models improve, best practices shift. This guide captures the current state of knowledge, but it won’t be the final word.
What won’t change: the fundamental challenge of measuring whether LLM outputs are good. Traditional metrics like BLEU fail completely. Human evaluation doesn’t scale. LLM-evaluators are powerful but imperfect. The tension between faithfulness and helpfulness persists. The need for systematic approaches remains.
Stay grounded in first principles:
- Define what “good” means for your domain
- Build evaluation datasets that represent real challenges
- Choose appropriate methods and metrics
- Understand limitations and biases
- Apply the scientific method
- Maintain human oversight
- Iterate continuously
The teams succeeding with LLM products aren’t waiting for perfect evaluation tools. They’re shipping with good-enough evaluation at scale, knowing and managing limitations, improving continuously through disciplined practice.
That’s the path forward. Not magic, not genius—systematic, boring, effective evaluation practices applied with organizational discipline.
Final thought
”If you can’t measure it, you can’t improve it.”
The evaluation bottleneck strangling LLM product development is real, but it’s solvable. Move beyond vibe checks. Build systematic evaluation into your development process. Measure rigorously. Iterate based on data, not intuition.
Your users—and your product—will thank you.
Appendix: Tools and Resources
This appendix provides curated resources for deepening your evaluation practice—frameworks for implementation, benchmarks for testing, and research papers for understanding the foundations.
Evaluation frameworks and tools
Production-ready frameworks:
-
OpenAI Evals: Open-source framework for creating and running evaluations. Extensible architecture, community-contributed eval templates, integrates with OpenAI API. Good starting point for teams new to systematic evaluation.
-
LangChain Evaluation: Evaluation utilities integrated with LangChain’s LLM application framework. Includes reference-based, criteria-based, and pairwise evaluators. Useful if you’re already building with LangChain.
-
Anthropic’s Claude Evals: Documentation and best practices for evaluating Claude-based applications. Focus on constitutional AI and critique-based evaluation approaches.
-
Promptfoo: Open-source tool for testing and evaluating LLM outputs. Supports multiple providers, configurable test cases, and automated regression testing.
Research and specialized tools:
-
DeepEval: Open-source evaluation framework with 14+ metrics for LLMs including G-Eval, hallucination detection, toxicity, and bias. Features unit testing interface, synthetic dataset generation, and integration with CI/CD pipelines. Good for teams wanting pytest-style evaluation workflows.
-
AlignEval: Tool from Alignment Research Center for calibrating automated evaluators against human judgment. Implements techniques for measuring and improving evaluator-human alignment.
-
RAGAS: Framework specifically for evaluating Retrieval-Augmented Generation systems. Measures faithfulness, answer relevance, context precision, and context recall.
-
TruLens: Evaluation and tracking for LLM applications with focus on groundedness, relevance, and harmlessness. Provides instrumentation for debugging evaluation failures.
Specialized evaluators:
-
SelfCheckGPT: Consistency-based hallucination detection. Generates multiple responses to the same query and measures consistency—inconsistency signals hallucination.
-
SummaC, QAFactEval, RefChecker: Claim-based faithfulness evaluation. Decomposes responses into atomic claims and verifies each against source documents.
-
Prometheus, Shepherd, CriticGPT: Finetuned evaluator models trained on human preference data. Strong performance on specific tasks but limited generalization.
Benchmarks and evaluation datasets
Long-context comprehension:
-
NarrativeQA: 1,500 stories with questions generated from Wikipedia summaries. Tests deep comprehension rather than shallow pattern matching. Essential reference for question generation methodology.
-
QASPER: 5,049 questions on NLP research papers. Domain-specific, requires technical understanding and multi-hop reasoning.
-
L-Eval: Multi-task long-context evaluation suite. Covers summarization, QA, and reasoning across diverse domains.
-
HELMET: Hierarchical Evaluation for Long-context Models. Tests both retrieval and reasoning capabilities separately.
RAG and faithfulness:
-
RGB Benchmark: Retrieval-Grounded Benchmark for evaluating noise robustness, negative rejection, and information integration in RAG systems.
-
SummEval: Summarization evaluation with human annotations for faithfulness, relevance, coherence, and consistency.
-
HaluEval: Large-scale hallucination evaluation benchmark covering QA, dialogue, and summarization tasks.
Multi-turn and conversational:
-
MT-Bench: Multi-turn conversation benchmark with 80 high-quality questions spanning writing, roleplay, reasoning, math, coding, and knowledge. Includes LLM-as-judge evaluation pipeline.
-
Chatbot Arena: Large-scale human preference data from pairwise comparisons. Over 500K human votes across diverse models and prompts.
Domain-specific:
-
MedQA: Medical question answering from USMLE exams. Tests domain knowledge and reasoning.
-
LegalBench: 162 legal reasoning tasks across issue-spotting, rule application, and interpretation.
-
FinanceBench: Financial question answering requiring reasoning over earnings reports and financial statements.
Research papers: Foundations and cutting edge
Core evaluation methodology:
-
G-Eval: NLG Evaluation using GPT-4 with Better Human Alignment (Liu et al., 2023) - Introduces Chain-of-Thought evaluation and form-filling for improved LLM-as-judge accuracy. arXiv:2303.16634[^geval]
-
Judging LLM-as-a-Judge with MT-Bench and Chatbot Arena (Zheng et al., 2023) - Documents position bias, agreement patterns, and best practices for LLM evaluators. Essential reading. arXiv:2306.05685[^judging-llm-judge]
-
The NarrativeQA Reading Comprehension Challenge (Kočiský et al., 2018) - Foundational work on question generation from summaries to encourage deep comprehension. arXiv:1712.07040[^narrativeqa]
Bias and limitations:
-
Large Language Models are Inconsistent and Biased Evaluators (Panickssery et al., 2024) - Comprehensive analysis of LLM-evaluator biases including position, verbosity, and self-enhancement. arXiv:2405.01724[^llm-bias]
-
Judging the Judges: A Systematic Investigation of Position Bias in Pairwise Comparative Assessments by LLMs (Li et al., 2024) - Deep dive into position bias mechanisms and mitigation strategies. arXiv:2406.07791[^position-bias]
-
Split and Merge: Aligning Position Biases in LLM-based Evaluators (Li et al., 2024) - Introduces PORTIA method for position bias mitigation through multiple orderings. EMNLP 2024[^portia]
Agreement and correlation:
-
A Coefficient of Agreement for Nominal Scales (Cohen, 1960) - Original Cohen’s kappa paper. Foundation for measuring inter-annotator agreement beyond chance. Interpretation guidelines from Landis & Koch (1977).[^cohen-kappa]
-
Inter-Coder Agreement for Computational Linguistics (Artstein & Poesio, 2008) - Comprehensive treatment of agreement metrics and their proper application in NLP contexts.[^artstein-poesio]
Advanced techniques:
-
Constitutional AI: Harmlessness from AI Feedback (Anthropic, 2022) - Critique-based evaluation and iterative refinement. Foundation for self-improvement approaches.
-
Improving Factuality and Reasoning in Language Models through Multiagent Debate (Du et al., 2023) - Multiple LLM evaluators debating to reach consensus. Improves accuracy but increases cost. arXiv:2305.14325[^multiagent-debate]
-
Panel of LLMs: A Novel Ensemble for LLM Evaluation (Chan et al., 2024) - Combining multiple LLM-evaluators to reduce individual model biases and improve reliability.[^poll]
Finetuned evaluators:
-
Prometheus: Inducing Fine-grained Evaluation Capability in Language Models (Kim et al., 2023) - Training specialized evaluator models. Strong on specific tasks, weak on generalization.[^finetuned-eval]
-
CriticGPT (OpenAI, 2024) - Finetuned model for finding bugs in code. Demonstrates value and limitations of specialized evaluators.
Faithfulness and hallucination detection:
-
SelfCheckGPT: Zero-Resource Black-Box Hallucination Detection for Generative Large Language Models (Manakul et al., 2023) - Consistency-based approach that doesn’t require source documents.
-
SummaC: Re-Visiting NLI-based Models for Inconsistency Detection in Summarization (Laban et al., 2022) - Claim-based faithfulness using natural language inference.
Learning resources and practical guides
Comprehensive guides:
-
Patterns for Building LLM-based Systems & Products by Eugene Yan - Practical patterns from production experience. Covers evaluation, monitoring, and debugging throughout.
-
AI Evals for Engineers and PMs by Hamel Husain and Shreya Shankar - End-to-end guide to building evaluation pipelines. Emphasis on practical implementation over theory.
-
Anthropic’s Evaluation Documentation - Best practices for evaluating Claude-based applications. Constitutional AI principles and critique-based evaluation.
-
OpenAI Cookbook: Evaluation - Practical examples and code for implementing various evaluation approaches with OpenAI models.
Community resources:
-
Hugging Face Evaluate Library - Open-source library with evaluation metrics and model evaluation tools.
-
LangChain Blog: Evaluation Series - Regular posts on evaluation techniques, case studies, and best practices.
Common Problems and Solutions
Troubleshooting Guide
Problem: Low inter-annotator agreement (κ < 0.40)
Bad approach: “It’s subjective, proceed anyway”
Good approach:
- Review 10 disagreement cases with annotators
- Identify pattern: are guidelines unclear? Is task too subjective?
- Refine guidelines with concrete examples
- Run another calibration session
- If still low, consider simplifying criteria (e.g., binary instead of 5-point scale)
Problem: LLM evaluator has 90% precision but 30% recall
Bad approach: “Precision is high, ship it”
Good approach:
- Identify use case: Is this a guardrail? If yes, recall matters most!
- Lower threshold or adjust prompts to increase recall
- Accept some precision loss if needed (false positives < false negatives for guardrails)
- Add human review of borderline cases
- Target: Recall > 0.85 for guardrails, even if precision drops to 0.70
Problem: Evaluation too expensive (thousands of LLM calls/day)
Bad approach: Reduce eval coverage or frequency
Good approach:
- Implement tiered evaluation pipeline:
- Tier 1: Code checks (free, instant)
- Tier 2: Cheaper LLM for screening (GPT-3.5, Claude Haiku)
- Tier 3: Premium LLM only for flagged cases
- Sample strategically: 100% of flagged outputs, 5-10% of clean outputs
- Consider finetuning a smaller model for high-volume, narrow tasks
- Use caching for repeated evaluations
Problem: Evaluator performance degrading over time
Bad approach: “It worked at launch, must be fine”
Good approach:
- Check monthly calibration data - has agreement dropped?
- Review recent failure cases - new failure modes emerging?
- User behavior shift? New query patterns?
- Model drift? Provider updated their model?
- Update eval dataset with new failure examples
- Retrain or adjust prompts based on findings
Problem: Can’t decide between faithfulness and helpfulness priority
Bad approach: “Let’s optimize both equally”
Good approach:
- Ask: What’s worse for users?
- Users getting wrong info (faithfulness failure)
- Users getting incomplete/irrelevant info (helpfulness failure)
- Domain analysis:
- Legal/medical/compliance → faithfulness priority
- Consumer support/creative → helpfulness priority
- Enterprise search → balanced
- Start with your domain’s default, measure user satisfaction
- Adjust based on actual user feedback and complaints
Problem: Too many false positives from automated evaluator
Bad approach: “Turn off the evaluator”
Good approach:
- Measure current precision on labeled sample (100 cases)
- Review false positives - what’s the pattern?
- Common causes:
- Evaluator too strict (adjust prompts, add examples)
- Overfitting to training distribution (expand eval dataset diversity)
- Position/verbosity bias (implement mitigations)
- Iterate on evaluator, re-measure precision
- Target: Precision > 0.70 to avoid alert fatigue
Problem: Team wants to ship before evals pass threshold
Bad approach: “Just this once, we’ll fix it later” (never happens)
Good approach:
- Make tradeoffs explicit:
- Current: 75% accuracy, target: 85%
- Risk: 10% of users see failures
- Business impact: X complaints/day, Y support cost
- Document decision and timeline for fixes
- Implement monitoring to track actual failure rate
- Schedule follow-up to hit threshold within 2-4 weeks
- Or adjust threshold with leadership buy-in, understanding consequences
Quick Reference: Decision Trees
When Should I Use Which Evaluation Method?
When Should I Add Advanced Techniques?
| Technique | When to Use | When to Skip |
|---|---|---|
| Chain-of-Thought | High-stakes decisions, need transparency | Rapid iteration, cost-sensitive |
| Few-shot examples | Nuanced criteria, domain-specific | Simple binary decisions, clear criteria |
| Cross-examination | Legal/medical domains, critical monitoring | Development, high-volume, low-stakes |
| Both-orderings (pairwise) | ANY pairwise comparison | Never skip for pairwise |
| Third-party evaluator | Production systems, final decisions | Early prototyping, budget-constrained |
Acknowledgments
This guide synthesizes research and production experience from many sources. Special thanks to the researchers and practitioners who’ve made their work public, particularly:
- The teams at OpenAI, Anthropic, Google DeepMind, and Meta for advancing LLM evaluation methodology
- The academic community for rigorous analysis of evaluator biases and limitations
- Practitioners sharing production lessons: Eugene Yan, Hamel Husain, Shreya Shankar, and many others
- The open-source community building evaluation frameworks and tools